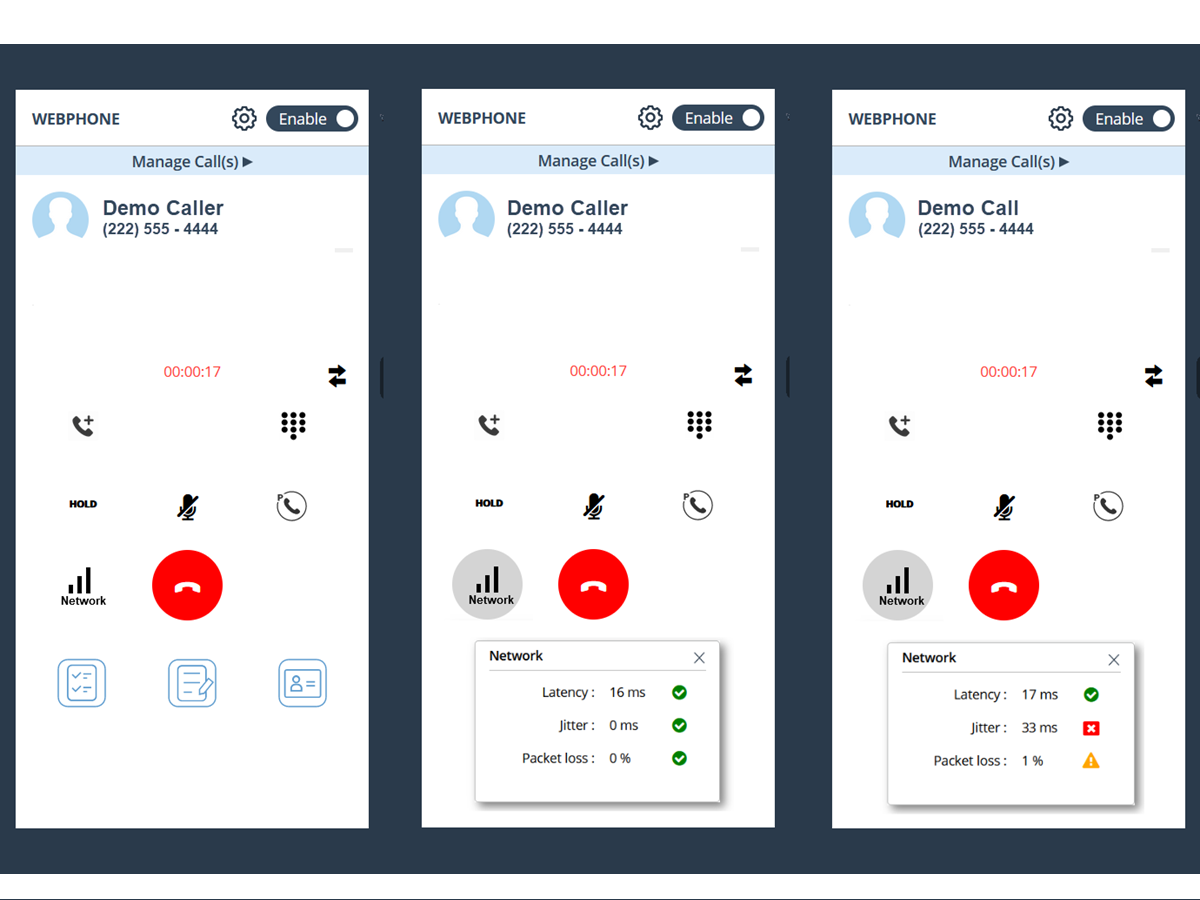
As part of our commitment to providing reliable, high-quality calls, we’ve recently added a new feature to the webphone in our Unified Communications (UC) client. Webphone users can now view real-time network metrics during active calls.
The purpose of this update is to provide greater insight when troubleshooting call quality. Since network issues can significantly impact call quality, leading to dropped calls, poor audio, and frustrated users, these added metrics provide another set of tools to identify and isolate issues that impede clear, reliable, high-quality calls.

The metrics provided are:
- Latency: See the delay in data transmission between the user’s machine and the server that is connecting the call.
- Jitter: Congestion on the end-user’s network and packet loss cause packets to arrive at the receiver with varying amounts of delay. That delay is called “jitter” and it is measured in ping.
- Packet Loss: Occasionally, transmitted packets of information will fail to arrive at their destination. The loss of packets is measured in percentage (lost packets/total packets). The higher the loss, the choppier the call quality will be.
To decipher the metrics, dynamic “grades” are provided in icon form. Green checkmarks signify a healthy connection. Yellow exclamations suggest degraded performance that may cause reduced call quality. Red blocks identify reasons for poor call experience.
The Network panel is easily accessible within the webphone module of our UC client. Users can toggle the panel on and off as needed, allowing for flexible monitoring without disrupting their workflow.
Current partners can contact their partner advocate to learn more about this new feature and how you can incorporate it into your product offerings. Prospective partners can schedule a discovery call today to learn more about this new feature.


